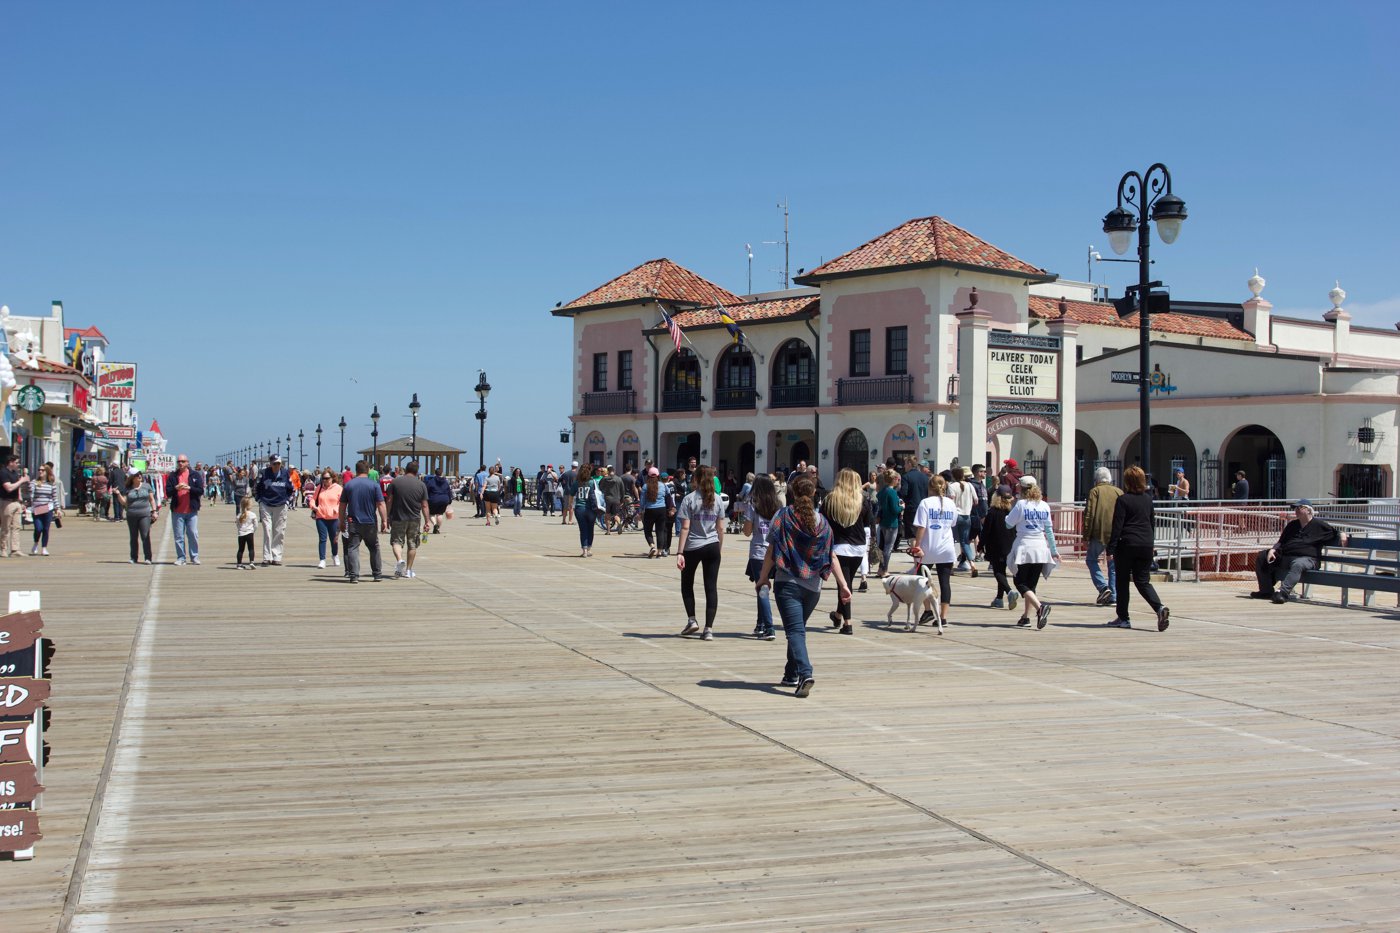

Ocean City, New Jersey's median home sale price hit $1.2 million in October, and the median time on market was 59 days. That puts the reported listing time at about two months, with substantial differences by property. But October's closings tell a more useful story. A three-bedroom West Avenue condo went contingent in nine days and sold above asking, while a five-bedroom Ocean Road home sold after 334 days on the market. Both were October sales, and they called for very different pricing strategies. Realtor.com October city data | Redfin October sales | West Avenue sale history
October 2026 market at a glance
| Ocean City, NJ metric | October 2026 |
|---|---|
| Median sale price | $1,200,000 |
| Median asking price | $1,399,000 |
| Median days on market | 59 days |
| Active listings tracked | 359 |
| Average sale-to-list price ratio | About 98% |
The 59-day median was down from 71 days in September, yet about 26% higher than a year earlier. The median sale price was up about 14% year over year. A different mix of homes closing can move the median, so use recent sales of comparable properties to estimate your own home's value. Realtor.com October city data
If you're looking for averages, a separate local MLS report showed an average sale price of about $1.54 million and 53 average days on market in its rolling 30-day sample checked November 10. That window includes early November. The October-only citywide figures above are medians. Build closing time into your plans separately, especially if the buyer needs financing. Local 30-day MLS report
What sold in Ocean City in October?
Buyers closed across a wide range. A one-bedroom Bay Avenue condo sold for $525,000. A three-bedroom first-floor Asbury Avenue condo sold for $1.2 million, and a five-bedroom Wesley Avenue property closed at $4.65 million. The West Avenue condo mentioned above closed at $975,000 after listing at $949,000. Condos accounted for about seven in ten sales in a separate 12-month local MLS snapshot, making them a good place to start when looking for the deepest pool of recent comparable sales. Redfin October sales | West Avenue sale history | Local MLS snapshot as of November 1
What was still sitting, and what are buyers looking for?
Two late-October listings still showed as active in our MLS feed on November 10. A three-bedroom South End condo at 5605 Asbury Avenue was asking $949,900, and a three-bedroom single-family home at 31 Simpson Avenue was asking about $1.5 million. At month-end, a local MLS snapshot also showed more supply relative to sales in Central, the Gold Coast and the Gardens than in the North End or South End. That gives buyers more alternatives in some parts of town and makes the immediate competition especially important for sellers. Late-October listing snapshot | 5605 Asbury Avenue | 31 Simpson Avenue | Neighborhood inventory
My read on what buyers value most is a home that's easy to use and easy to budget for. For a three- or four-bedroom shore condo, that means looking at off-street parking, outdoor space, beach or bay access, and how much work the home needs before next summer. Buyers who plan to rent should also check rental rules, condo fees, insurance costs and any upcoming assessments. Those are practical buying priorities. The sales figures measure what closed, so they only tell us part of the story about what buyers wanted.
Did interest rates affect the market?
Freddie Mac's national average for a 30-year fixed mortgage started October at 7.28%, reached 7.40% midmonth and eased to 7.24% on October 29. That eased the monthly payment slightly from the midmonth peak. The bigger affordability story was the comparison with 6.17% a year earlier. On an illustrative $750,000, 30-year loan, that difference is about $530 more per month in principal and interest before taxes, insurance or condo fees. That helps explain why financed buyers might scrutinize the price or ask for a credit. October closings can reflect contracts signed weeks earlier, so the late-month dip is best understood as a change in what buyers could afford as they entered November. Freddie Mac weekly rate archive | Freddie Mac October 29 release
What is your Ocean City home worth today?
The first number I'd look at is what a buyer just paid for a home like yours on a comparable block. Then I'd compare it with what that same buyer can tour today. Let The Quintin Group help you compare recent sales, competing listings and your property's location and condition.
Data reviewed November 10, 2026. October citywide statistics, rolling sales samples and later inventory snapshots are labeled by period in this article. Figures may be revised as additional transactions are reported.
Jeff Quintin
The Quintin Group | eXp Realty
Make your move.